Nom accounts

rob

Active member
Joined
Jul 8, 2024
Posts
63
Reaction score
109
Trophy points
34
Nom accounts out https://www.nominet.uk/wp-content/uploads/2024/07/FY24-Annual-Report-and-Accounts.pdf

https://community.nominet.uk/t/nominets-fy24-annual-report-accounts/2115 has some commentary from @andrew if he wants to replicate it here.

From the report: "Group revenue increased in the year by £2.3m (4.2%) to £56.4m driven by a £2.7m increase in Cyber revenue offset by a £0.4m reduction in Registry revenue. The .UK register at 31 March 2024 closed at 10.7 million DUM (31 March 2023 – 11.0 million) with .UK market share at 53.4% of the domain market share (31 March 2023 – 54%)." etc.
 
Kevin has done a much better job than me:

 
It is a noticeably less jazzy document this year. That could be seen as less fluff as previous years, or less commentary and less opportunity to communicate.

The UKRAC has previously had a page giving a quick run down of what it has been up to - and I requested, and was successful, to get a line in on the overall cost to run it in last years finance statement doc https://www.nominet.uk/wp-content/uploads/2023/09/Annual-Report-2023.pdf

historic: *"UKRAC members are paid a fixed per diem fee of £500 per meeting attendance *
the UKRAC is administered by an independent secretariat. The total direct costs of holding these meetings in 2022-23 amounted to £43,554.
of £500 per meeting attendance, and etc etc


This appears to have been dropped this year, along with the page about the UKRAC. I don't think that is a positive change.
 
The .UK register at 31 March 2024 closed at 10.7 million DUM (31 March 2023 – 11.0 million) with .UK market share at 53.4% of the domain market share (31 March 2023 – 54%).
Sorry for being thick, but can someone explain what they mean by market share? Do they mean .UK (including .co.uk, .org.uk, .uk etc) as a total of the total domain market? I don't know how they got to that figure.
 
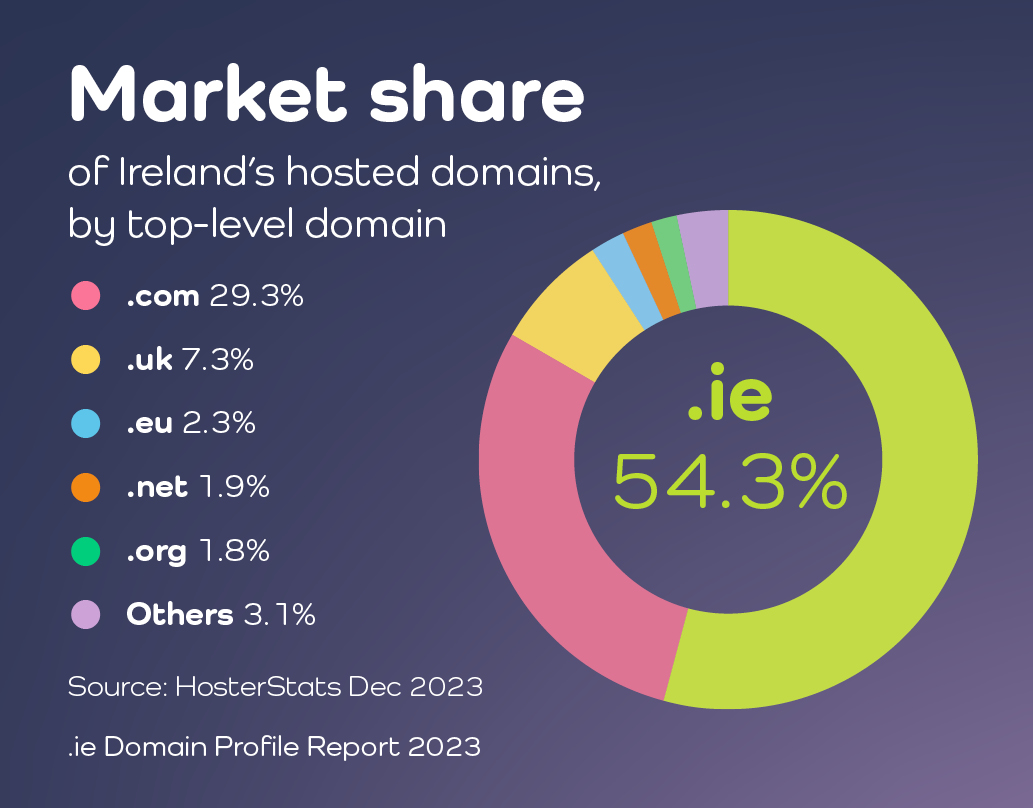
You can see a better example in the .ie domain profile report which actually has graphs:

07134-IE-DPR-2023-10-Snippets-4.jpg
 
You can see a better example in the .ie domain profile report which actually has graphs:

07134-IE-DPR-2023-10-Snippets-4.jpg

@whois-search, do you have a link to the equivalent figures for domains hosted in the UK (with or without a doughnut/pie chart)?

More generally, are there any figures available for the percentages of UK-hosted TLDs that resolve to a website?
 
Thanks for the links, but I'm still confused.

If Nominet's 10.7 million .uk domains represent 53.4% "of all top-level domains hosted in" the UK (to use the same wording as the .ie Domain Profile Report) then the total number of TLDs hosted in the UK is 20 million.

Subtracting Nominet's 10.7 million and the 2.2 million gTLDs specified in row 10 of this table leaves 7.1 million domains that can only be new gTLDs and other country ccTLDs.

That figure seems completely ridiculous to me, so can anyone shed any light on where I'm going wrong here?
 
2.2 million gTLDs specified in row 10 of this table
You're comparing vastly different things - the 2.2 million (the value of which is somewhat 'suspect' anyway) ois the total number of gTLD registrations done through accredited registrars whose IANA# is marked as "UK" - not in any way related to where they are hosted, or actually where the registrar really is.

The Nominet claim doesn't make any sense (and you can only get close to the figure by comparing total domains in a ccTLD vs other domains where the nameservers resolve to an IP an RIR says is UK) - it is like comparing total Apples grown at a farm and number of IKEA bookcases assembled - no comparison of such differing objects will ever be meaningful.

There have been attempts to use zone files and ip lookups to determine how many names are unused vs parked vs hosted at X - any figures from those need taking with several kilos of NaCl and the few of those I had bookmarked with useful numbers are all discontinued or behind paywalls and woefully out of date.

Directi had one a long time ago (with a well documented but highly flawed methodology) but at least gave something quotable at the time - last version I have saved of that showed 53% of 259 million domains had 'content' - you can probably scale that up to the 600 million or so there are now.

At a Google event last May they claimed almost 2 billion websites were online and indexed - which must mean a lot of subdomain use - especially as a different speaker claimed under 1/3rd of the internet was indexed !

The CENTR report is somewhat realistic, although their methodology relies on a combo of self-reporting by members and complete stick-a-finger-in-the-air guesswork from zooknic

If I was to 'quote' registration stats - https://domainnamestat.com/statistics/country/others
although whos-protect/proxy services will skew the numbers heavily
- zoom in to the 2020 "unknown" to see the GDPR impacts

But reg-stats have zero connection to use-stats ...
 
Thanks Rob.

So basically you're saying that we shouldn't take any notice of Nominet's market share figure.

On reflection, the clue is that they don't define ".UK market share" or give the source or methodology for claiming 53.4% of it.

In fact, the phrase "with .UK market share at 53.4% of the domain market share" doesn't even make sense.

It must be one of those "nobody knows" questions, like they have on QI.
 
So basically you're saying that we shouldn't take any notice of Nominet's market share figure

Pretty much.

Whilst they'll be getting the numbers from somewhere (probably netcraft) that they think are of some meaning, the figures may-as-well come from
shuf -i 1-100 -n 1
as it'll be equally as accurate :)
 
Back
Top