You are using an out of date browser. It may not display this or other websites correctly.
You should upgrade or use an alternative browser.
You should upgrade or use an alternative browser.
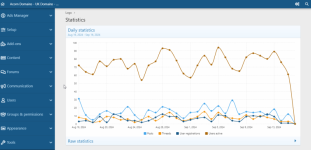
Oldcorn stats are in for last 30 days
- Thread starter ben
- Start date
Where were they sourced?

Complete - A quick UI update
Dear Acorn Domainers, We have just a quick UI upgrade that shows that the user is active. Just check it for yourself. And just keep domaining!
Playing devil's advocate, the last (rightmost) point on the graph may well be at 0 until stats are processed or the day ends. The two previous days are weekend days which normally see a dip. Looks worse than it is to me.
Still, would be interesting to see the stats excluding the automated posts.
Still, would be interesting to see the stats excluding the automated posts.
seemly
Active member
- Joined
- Jul 8, 2024
- Posts
- 117
- Reaction score
- 238
- Trophy points
- 44
There is almost zero organic user generated content on that site.Playing devil's advocate, the last (rightmost) point on the graph may well be at 0 until stats are processed or the day ends. The two previous days are weekend days which normally see a dip. Looks worse than it is to me.
Still, would be interesting to see the stats excluding the automated posts.
Outside of imported feeds, UK Backorder and Domainlore Auctions, and the odd member domain sales, the only "organic" posts I've seen are from Helmuts asking for member input (but the only feedback Helmuts thinks is valid comes from MapleDots), and whether the over-engineered offline/online icon is good (it's not).
ben
Active member
- Joined
- Jul 8, 2024
- Posts
- 264
- Reaction score
- 201
- Trophy points
- 44
The dip is definitely pre-day process of that day stats. But this graph shows only, what, 70/80 members active ? Includes bots? Look at the baseline of content generated. That’s the real determining factor here.
Even then, how many new registrations are bots? How many new topics or posts are RSS feed bots? Last time I saw the stats public members on there it was 50k+ members on Acorn, now with only average 70 active? Painful. Very very painful.
Then there’s this shit…

???? 424 guests??
Even then, how many new registrations are bots? How many new topics or posts are RSS feed bots? Last time I saw the stats public members on there it was 50k+ members on Acorn, now with only average 70 active? Painful. Very very painful.
Then there’s this shit…

???? 424 guests??
